What is FAIR risk quantification?
FAIR is a model for expressing information risk in financial terms. It defines risk as the probable frequency and probable magnitude of future loss, then breaks each side into factors small enough to estimate. The Open Group publishes it as the Risk Taxonomy (O-RT) and Risk Analysis (O-RA) standards, and the FAIR Institute stewards the community around it.
The point of the model is the output. A risk register that scores likelihood and impact from 1 to 5 produces a number nobody can translate into dollars. FAIR produces a distribution of annual loss in currency, which can be compared with the cost of the control that reduces it. That is the difference between a risk conversation and a budget decision.
What are the two numbers that decide everything?
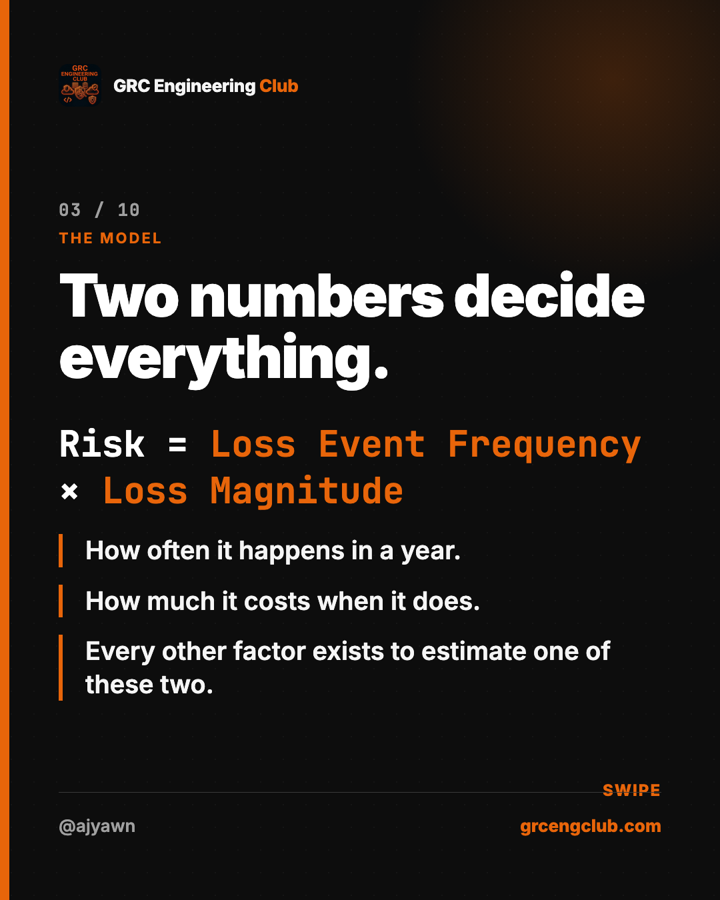
Risk = Loss Event Frequency (LEF) × Loss Magnitude (LM)

LEF = Threat Event Frequency (TEF) × Vulnerability (Vuln)
LM  = Primary Loss + Secondary Loss
Loss event frequency is how many times a year a loss event happens. It splits into threat event frequency (how often someone tries) and vulnerability (the probability a try succeeds given the controls in place). This is where your controls show up in the math: enforcing hardware MFA on every account does nothing to how often attackers phish your staff, and a great deal to how often it works.
Loss magnitude is what one event costs. Primary loss covers response, replacement, and lost productivity. Secondary loss covers fines, customer churn, legal cost, and reputation. Secondary is usually where the money is, and it is the half most registers never estimate.
Vulnerability in FAIR is a probability, a different meaning from a CVE or a scanner finding. Mixing the two meanings is the most common way a first FAIR analysis goes wrong.
Why does FAIR use ranges instead of single scores?
Nobody knows how many credential-theft events a company will suffer next year. Everyone can say it is probably between 2 and 6, most likely 3. A range is honest about what you know, and three honest ranges beat one confident point estimate. The calibration test is simple: would you bet your own money that the true value lands inside the range? If the answer is no, widen it until the answer is yes.
Ranges also make the math possible. Sampling each range thousands of times (a Monte Carlo simulation, which runs in a spreadsheet or a dozen lines of Python) produces a distribution of annual loss instead of a single number. Report the median and the 90th percentile, the year that hurts, next to each other. An average hides the year the board actually cares about.
What does a FAIR analysis look like for one risk?
The numbers below are illustrative. Yours will differ, and that is the point. The risk sentence: an external attacker uses a stolen credential to pull customer data from the production database.
| Factor | Minimum | Most likely | Maximum |
|---|---|---|---|
| Threat event frequency (attempts per year) | 10 | 30 | 60 |
| Vulnerability (probability an attempt succeeds) | 5% | 10% | 20% |
| Loss event frequency (events per year) | 0.5 | 3 | 12 |
| Primary loss per event | $40K | $90K | $250K |
| Secondary loss per event | $50K | $300K | $1.2M |
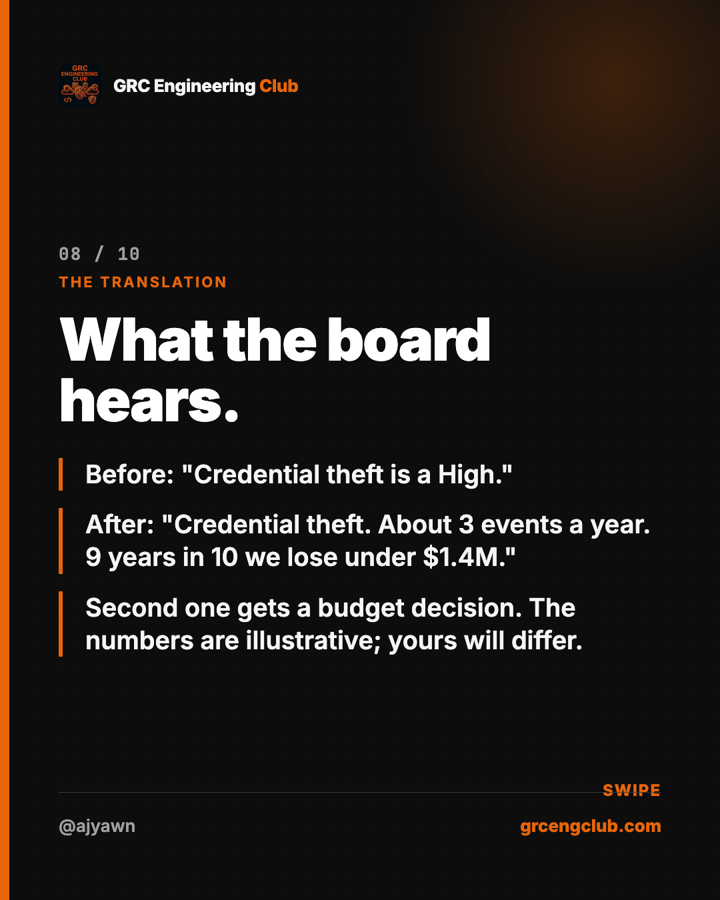
Simulated, those ranges produce an annual loss distribution with a median around $900K and a 90th percentile around $1.4M (illustrative). The sentence that reaches the board: "Credential theft. About 3 events a year. 9 years in 10 we lose under $1.4M." Put the cost of hardware MFA next to that sentence and the decision makes itself. Before FAIR, the same risk read "Credential theft: High."
How do you make FAIR fit your organization?
FAIR is a vocabulary and a structure, not a mandate. Keep the terms exactly as the standard defines them so an estimate from the security team means the same thing to finance. Everything else is yours to set: the loss tables (what a record, an hour of downtime, or a regulatory finding costs you), the frequency baselines from your own incident history, and the thresholds that trigger action. A model you cannot adapt to your business will be ignored by your business.
GRC engineers go one step further and store the ranges as data next to the controls that reduce them, so a failed control check can move the vulnerability estimate without a meeting. The AI risk assessment guide applies the same structure to model and agent risk.
How do you start FAIR with one risk this week?
- Write the risk as a sentence. Name the threat, the asset, and the loss in one sentence, for example: an external attacker uses a stolen credential to pull customer data from the production database.
- Estimate loss event frequency as a range. Estimate how often someone tries (threat event frequency) and the probability a try succeeds given current controls (vulnerability). Record minimum, most likely, and maximum per year.
- Estimate loss magnitude as a range. Estimate primary loss (response, replacement, lost productivity) and secondary loss (fines, customer churn, legal, reputation) as minimum, most likely, and maximum in currency.
- Calibrate the ranges. Ask whether you would bet your own money that the true value falls inside each range. Widen any range until the answer is yes.
- Simulate and read the distribution. Sample each range thousands of times (Monte Carlo) to produce a distribution of annual loss. Report the median and the 90th percentile.
- Write down the reasoning and compare to the control. Record why each range is what it is, then compare the loss distribution with the cost of the control that would reduce it. Repeat for the next risk.
Pick the risk your board asks about most. One risk, two estimates, one reason written down. The second risk is easier, and by the fifth you have a model shaped around your organization instead of a template.
What is in the 10-slide starter guide?
The PDF is the carousel version of this page, built for a risk committee, a team channel, or a LinkedIn repost. One idea per slide.
- 01Put a number on it. FAIR in 10 slides. No spreadsheet required to start.
- 02Risk is a sentence. A threat does something to an asset and produces a loss. If you cannot write the sentence, you cannot quantify the risk.
- 03Two numbers decide everything. Risk = loss event frequency times loss magnitude. Every other factor estimates one of these two.
- 04Frequency splits in two. Threat event frequency times vulnerability. Your controls live in the vulnerability number.
- 05Magnitude has two halves. Primary loss and secondary loss. Secondary is usually where the money is, and the half most registers skip.
- 06Ranges, never points. Minimum, most likely, maximum. Calibration test: would you bet your own money on the range?
- 07Run it, do not average it. Monte Carlo sampling gives a distribution of annual loss. Report the 90th percentile next to the median.
- 08What the board hears. "About 3 events a year. 9 years in 10 we lose under $1.4M." That sentence gets a budget decision.
- 09Make the model yours. FAIR is a vocabulary and a structure. Keep the terms, set your own ranges, loss tables, and thresholds.
- 10One risk, two estimates, one reason. Pick the risk your board asks about most. Estimate both numbers as ranges. Write down why.
Frequently asked questions
What is FAIR risk quantification?
FAIR, Factor Analysis of Information Risk, is a model for expressing cyber and operational risk in financial terms. It defines risk as the probable frequency and probable magnitude of future loss, and breaks each side into factors you can estimate with ranges. The result is a distribution of annual loss in dollars instead of a color on a heat map.
What are the two numbers in FAIR?
Loss event frequency (how many times a year a loss event happens) and loss magnitude (how much each event costs). Risk is the product of the two. Every other FAIR factor exists to estimate one of them: threat event frequency and vulnerability feed frequency, primary and secondary loss feed magnitude.
What does vulnerability mean in FAIR?
In FAIR, vulnerability is the probability that a threat event becomes a loss event, which is where your controls show up in the math. It is a different meaning from a CVE or a scanner finding. Enforcing MFA on every account lowers the FAIR vulnerability of a phished password because the attempt is less likely to succeed.
Do I need a Monte Carlo tool to use FAIR?
Not to start. You can write one risk as a sentence, estimate frequency and magnitude as minimum, most likely, and maximum ranges, and reason about the ranges by hand. A Monte Carlo simulation, which samples each range thousands of times to produce a loss distribution, is the next step and runs in a spreadsheet or a few lines of Python.
Is FAIR a standard?
FAIR is published by The Open Group as the Risk Taxonomy (O-RT) and Risk Analysis (O-RA) standards and is stewarded by the FAIR Institute. It is a vocabulary and a structure, not a mandate. Organizations keep the terms so estimates mean the same thing to everyone and set their own ranges, loss tables, and thresholds for action.
How is FAIR different from a risk register heat map?
A heat map scores likelihood and impact on ordinal scales such as 1 to 5 and multiplies them, which produces a number nobody can translate into dollars. FAIR estimates frequency per year and loss in currency as ranges, so a risk can be compared with the cost of the control that reduces it. The register still holds the risk; FAIR changes what goes in the rating columns.